The Quest for Microsecond Lookups on 1 billion Solana Keys
Benchmarking RocksDB, LMDB, and redb at 1 billion Solana keys — bootstrap, positive/negative reads, and live stream validation under memory pressure.
Why I Need This
I’m building a low-latency system on Solana blockchain with a component that needs to store a map of nearly 1 billion key-value pairs. Both keys and values are 32-byte values — specifically, Solana public keys. I need a disk-persistent database engine with fast read and write performance. Essentially, the component has three jobs:
- Bootstrap the database from hundreds of millions of records
- Consume a stream of thousands key-value events per second
- Stream out changed entries to other processes - IPC (Inter-Process Communication)
It must also be able to recover gracefully after a crash or restart. I’ll cover both recovery and IPC streaming in future posts.
In terms of architecture, there are two types of database engines: embedded and client-server. An embedded database runs within the application process itself, while a client-server database runs as a separate service that the application communicates with over the network. A client-server database adds overhead from network round-trips, query parsing, serialization, and protocol handling, while an embedded database directly queries the underlying storage engine within the same process, eliminating that latency entirely. For this reason, I chose an embedded database for my system. 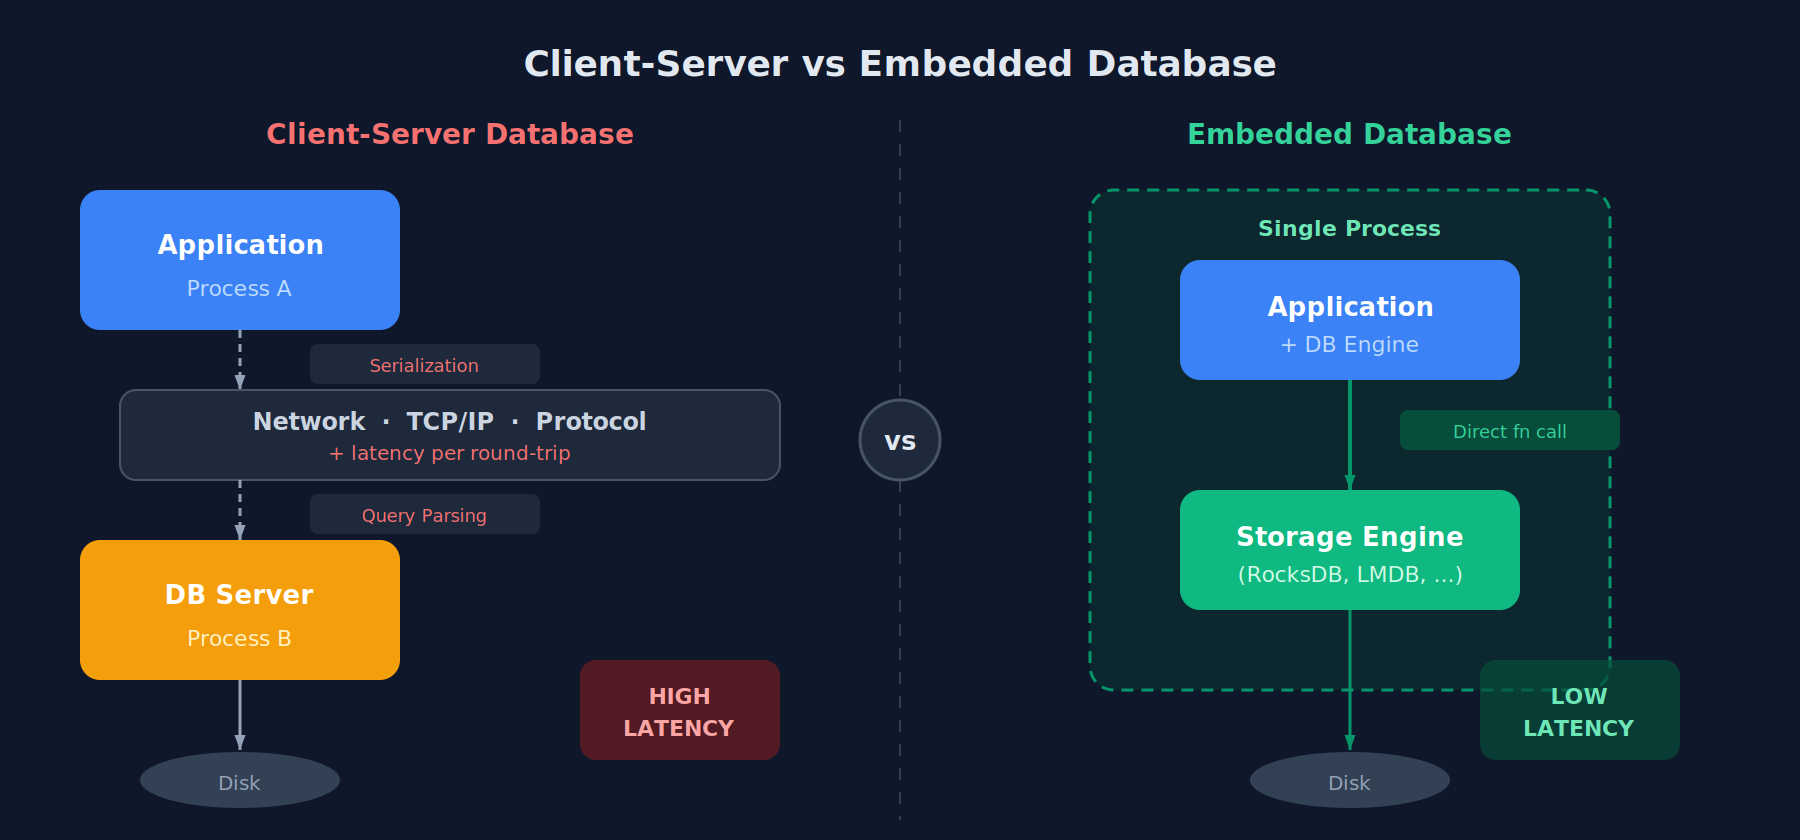
Not all embedded databases eliminate parsing overhead. SQLite, for example, is an embedded database but still includes a full SQL query parser, query planner, and bytecode compiler. These layers add latency that’s unnecessary when all you need is simple key-value lookups.
What’s Out There
Before reaching for a full database engine, consider simpler alternatives. At the most basic level, you could manage your own binary file — write sorted key-value pairs to disk, use binary search for lookups, and append new entries with periodic re-sorting. This gives you full control but forces you to handle crash recovery, index management, and file growth yourself. A step up is using memory-mapped files (mmap). You map a file directly into your process’s virtual address space and access it like a regular byte array — the OS handles paging data in and out of RAM transparently. This is how LMDB and libmdbx work under the hood. You could build a custom hash map or sorted array on top of mmap and get near-RAM read speeds with disk persistence for free.
So why not just do that? Because depending on your needs, you may also want crash safety, concurrent access, dynamic resizing, or efficient updates across hundreds of millions of entries — and each of these is a hard problem on its own. That’s exactly what embedded KV stores solve — they give you the raw speed of mmap or direct file I/O, with correctness guarantees already battle-tested by thousands of production deployments.
With a full database engine as the clear path forward, the question becomes: which one? Here are the major embedded key-value stores with direct get(key) → value access.
Table 1: Popular embedded key-value database engines.
| RocksDB | LMDB | libmdbx | LevelDB | sled | redb | |
|---|---|---|---|---|---|---|
| Dev | Meta | Symas | Positive Tech | T. Neely | C. Berner | |
| Language | C++ | C | C | C++ | Rust | Rust |
| Structure | LSM-tree | B+tree (mmap) | B+tree (mmap) | LSM-tree | Bw-tree (lock-free) | B+tree (custom I/O) |
| Maturity | Battle-tested: Meta, LinkedIn, CockroachDB | Proven: OpenLDAP, Monero | Ethereum: clients Erigon, Reth | Widely used but superseded by RocksDB | ⚠️ Beta in-progress rewrite | ⚠️ Young limited production use |
| Read | Moderate (LSM read amp) | Excellent (zero-copy mmap) | Excellent (improved LMDB) | Moderate | Good | Good (close to LMDB) |
| Write | Excellent (LSM batching) | Moderate (single writer) | Moderate–Good | Good | Moderate | Good |
| Compress | Snappy, LZ4, Zstd | ❌ | ❌ | Snappy | ❌ | ❌ |
| Tuning | Complex | Near-zero | Low | Low | Low | Low |
| Rust | FFIrust-rocksdb | FFIlmdb-rs | FFIlibmdbx-rs | FFIrusty-leveldb | Native | Native |
| Users | CockroachDB, TiKV, Flink | Monero, OpenLDAP, Caffe | Erigon, Akula, Reth | Chrome, Bigtable-style apps | Hobby/ experimental | Early adopters |
Table 1 lists six popular embedded key-value engines — researched with the help of AI, of course — along with their data structures, maturity, performance characteristics, and Rust ecosystem support.
From profiling the live data stream, I observe a roughly 98/2 read-to-write ratio. Given this access pattern, read latency is the dominant factor. Engines built on B+trees (LMDB, libmdbx, redb) have a natural advantage here, since they resolve point lookups in a single tree traversal, whereas LSM-tree engines (RocksDB) may need to check multiple levels before returning a result. If you had to pick just one based on this ratio alone, LMDB is the natural choice — zero-copy mmap reads, single tree traversal, and near-zero tuning required. That said, write performance still matters — the system must keep up with thousands of updates per second without stalling reads. But picking one without benchmarking is premature. I want to test a few candidates that cover both FFI (Foreign Function Interface) binding and native Rust, prioritize maturity, and span different data structures. My picks:
- RocksDB: LSM-tree, FFI, the most battle-tested option
- LMDB: B+tree, FFI, proven at scale with read-heavy workloads
- redb: B+tree, native Rust, an emerging alternative worth measuring against the established options
Setup & Metrics
To compare these three engines fairly, I designed a benchmark that mirrors my actual workload: starting with 700 million 32-byte key-value pairs for bootstrap benchmarks, growing to nearly 1 billion during the live stream phase. All tests ran single-threaded on an isolated CPU core.
- Bootstrap — bulk load all 700M entries with keys in random order, measuring negative read and write latency as the database grows
- Positive read — after bootstrap, query 10M random keys that exist in the database
- Live stream — consume the real gRPC stream for 10M events and measure performance under production conditions
For RocksDB, I tested two configurations: vanilla (default settings) and with bloom filters enabled (20 bits per key). Bloom filters allow RocksDB to skip disk reads entirely for non-existent keys, at the cost of ~1.7GB for 700M keys and ~2.5GB for 1B keys. LMDB and redb have no equivalent tuning — their B+tree lookups always traverse the tree regardless of key existence.
The metrics I focused on:
- Read latency — single
get(key)operation - Write latency — single
put(key, value) - Bootstrapping time — time to load 700M entries
- Disk space usage — storage footprint at 700M entries
- Memory consumption — RSS and page cache usage under load
- Performance stability — throughput consistency over time, including tail latency spikes during compaction (RocksDB) or page splits
The bootstrap data was not sorted — keys arrived in random order, matching the worst-case scenario for B+tree engines. We could pre-sort the keys before loading to take advantage of sequential insert optimizations like LMDB’s MDB_APPEND mode. However, I chose to bootstrap with random key order intentionally — it produces a more realistic B+tree layout that mirrors the fragmentation pattern of the live gRPC stream, giving more accurate read and write latency numbers for the benchmarks that follow.
Bootstrap Results
To get a first impression of the three engines, I ran a vanilla bootstrap and compared their disk usage, memory footprint, and bootstrap time.
Table 2: Vanilla bootstrap — disk usage, time, and memory footprint for 700M key-value pairs
| RocksDB | LMDB | redb | |
|---|---|---|---|
| Disk usage | 40.8 GB | 71.3 GB | 62.9 GB |
| Bootstrap time | 2.9 hours | 2.2 hours | 2.8 hours |
| Peak RSS | 356 MB | 63,740 MB | 1,180 MB |
RocksDB’s LSM-tree with compression produces the smallest on-disk footprint — nearly half of LMDB’s uncompressed B+tree. LMDB is the fastest to bootstrap despite random key order, but its RSS reflects the entire mmap’d database file loaded into the page cache. redb lands in the middle on all three metrics, with RSS appearing modest at ~1GB — but as we’ll see later, this number is misleading.
Disk usage and bootstrap time are tolerable trade-offs — the system bootstraps once, and storage is cheap. What matters most is read and write latency, and how they behave over time as the database grows. See Figure 1 below for the full latency progression across all engine configurations.
Click legend to toggle series · Dimmed = hidden
Figure 1: Average read and write latency during shuffled bootstrap of 700M key-value pairs.
"+ Bloom" denotes RocksDB with bloom filters enabled. "/ 32G" and "/ 64G" denote runs with memory capped via `systemd-run --scope -p MemoryMax=N`.
Write latency: RocksDB wins decisively at 1.7µs average with a remarkably flat line — writes go to an in-memory memtable regardless of database size, so latency stays constant. The trade-off is invisible here: background compaction threads flush and merge SST files asynchronously, meaning the true I/O cost is deferred rather than eliminated. LMDB (3.2µs) edges out redb (4.8µs), but both show steadily increasing write latency as the B+tree grows deeper and page cache pressure builds. Interestingly, limiting memory to 32GB has minimal impact on write latency across all engines — the write path depends more on dirty page flushing than on cache hits, unlike reads where cache misses are immediately felt.
Negative Read latency: LMDB leads at 2.6µs average, followed by redb at 4.2µs — both significantly faster than RocksDB’s 14.8µs. This is the B+tree advantage: a single tree traversal versus RocksDB’s multi-level SST file lookups.
Both LMDB and redb show latency spikes toward the end of the run as the database grows. But why? LMDB’s spike makes intuitive sense — its RSS climbs to 63GB as it mmaps the entire file. But redb’s RSS stays around 1GB, so what’s causing its spike?
Digging into redb’s changelog, I found that the mmap backend was removed in favor of standard file I/O — meaning redb uses pread/pwrite under the hood. These calls still go through the kernel page cache, just like mmap, but the cached pages are system-wide and don’t show up in the process’s RSS. Running vmtouch on the redb database file confirmed this — the majority of the file was resident in the page cache, invisible to htop.
So both engines depend on the same page cache for performance — LMDB just makes it visible via mmap (reported in RSS), while redb hides it in the kernel (only visible via vmtouch). To verify this theory, I used systemd-run --scope -p MemoryMax=<N> to cap memory and re-ran these engines. Since this was my first time limiting resources this way, I started with a generous 92GB cap to check for any unexpected performance degradation from the cgroup itself, before tightening to 32GB. The 92GB run showed no meaningful difference from unlimited — confirming the cgroup overhead itself is negligible and any slowdown at 32GB is purely from memory pressure.
When limiting memory to 32GB, the impact on negative read latency is dramatic. LMDB’s latency climbs linearly from ~5µs to over 180µs as the database outgrows the page cache — every lookup that misses cache hits disk. redb also degrades but more gracefully, reaching ~50µs at peak, suggesting its managed I/O approach handles cache pressure better than LMDB’s raw mmap. Meanwhile, RocksDB with bloom filters remains remarkably stable even under memory pressure — bloom filters reject non-existent keys in memory without ever touching disk, making it effectively immune to cache misses on negative reads.
Positive Read Latency
Last but not least — positive read latency. This is the most critical metric for my use case, because in the live gRPC stream, the vast majority of operations are lookups against keys that already exist in the database. To simulate this, I queried 10M random keys that exist in the database under various memory caps (1GB, 8GB, 16GB, 32GB, and 64GB). Not every engine was tested at every limit — I focused on the configurations that revealed meaningful differences. Toggle the legend in Figure 2 to explore each combination.
Note: Before each test, I flushed the system page cache with
echo 3 > /proc/sys/vm/drop_caches. All three engines rely on the kernel page cache — redb and RocksDB throughpread/pwrite, LMDB through mmap. These cached pages persist after the process exits, so without flushing, a memory-limited run could start with a warm cache from the previous run, skewing the results.
Click legend to toggle series · Dimmed = hidden
Figure 2: Positive read latency across memory limits — 10M queries on 700M keys
RocksDB shows a noisy but flat trend overall. At 64GB, latency oscillates around ~60–70µs. At 1GB, the line shifts up to ~120–130µs — roughly 2× slower — but remains flat rather than climbing over time.
redb shows impressive caching efficiency under memory pressure. Even at 1GB, its read latency plateaus at a flat ~121µs rather than climbing unboundedly. This suggests redb’s managed I/O naturally prioritizes keeping the upper levels of the B+tree (root and internal nodes) in its cache, while leaf node reads hit disk at a consistent cost. The result is a flat latency ceiling — a much more predictable performance profile than LMDB under the same constraints.
LMDB, by contrast, suffers the most from memory pressure. At 64GB it settles to ~20–30µs after initial warm-up — the fastest of the three. But at 16GB, latency jumps to ~300–350µs with violent spikes. At 1GB, it averages ~630µs — a 5x gap compared to redb’s ~121µs, despite both being B+tree engines. This gap likely comes from redb’s managed I/O giving it more control over which pages stay cached, while LMDB leaves that decision entirely to the OS.
So with unlimited RAM, all three engines deliver comparable positive read latency — LMDB at ~42µs, redb at ~56µs, and RocksDB at ~66µs. The differences are measurable but not dramatic. Under memory pressure, the picture changes entirely: RocksDB and redb both plateau at ~120–130µs even at 1GB, while LMDB degrades to ~630µs. For a system that may not always have the full dataset in RAM, this resilience matters.
Picking a Winner
Based on these results, I’m going with RocksDB. It’s not the fastest engine in any single metric — LMDB wins on read latency with unlimited RAM, and redb offers better memory efficiency under pressure. But RocksDB delivers the most consistent performance across all conditions: flat write latency regardless of database size, stable read latency under memory pressure, and minimal RAM requirements to reach peak performance. The bloom filter advantage also plays a strategic role. While the current workload is dominated by positive reads, excellent negative read performance provides headroom for future changes — if new event types introduce lookups against non-existent keys, RocksDB handles them at near-zero cost without any architectural changes.
Live Stream Validation
The bootstrap and positive read benchmarks used synthetic workloads — random keys loaded in bulk, then queried in isolation. The final test connects each engine to a real Solana gRPC stream and measures performance under production conditions: mixed reads, writes, and commits arriving at thousands of events per second, with the database now holding nearly 1 billion keys.
For durability, I commit every 1,000 events to disk. The “Commit / item” row in Table 3 reflects the amortized cost — total commit time divided by 1000.
Table 3: Live gRPC stream performance — 10M on ~1 billion keys, 64GB and 16GB memory limits.
| RocksDB 64G | RocksDB 16G | LMDB 64G | LMDB 16G | redb 64G | redb 16G | |
|---|---|---|---|---|---|---|
| Negative Read | ||||||
| avg | 3.4 µs | 3.5 µs | 273 µs | 450 µs | 94.6 µs | 133 µs |
| p90 | 3.5 µs | 3.6 µs | 304 µs | 613 µs | 99.3 µs | 143 µs |
| p99 | 7.1 µs | 16.0 µs | 312 µs | 1,630 µs | 104 µs | 151 µs |
| range | stable | stable + spikes | stable | spiky | stable | stable |
| Positive Read | ||||||
| avg | 5.4 µs | 5.4 µs | 3.8 µs | 7.9 µs | 2.1 µs | 2.3 µs |
| p90 | 6.9 µs | 6.9 µs | 5.3 µs | 11.8 µs | 2.6 µs | 3.7 µs |
| p99 | 11.9 µs | 14.2 µs | 7.5 µs | 32.6 µs | 3.8 µs | 4.8 µs |
| range | noisy | noisy | smooth | noisy | smooth | smooth |
| Write | ||||||
| avg | 4.3 µs | 6.3 µs | 1.4 µs | 2.1 µs | 6.3 µs | 6.5 µs |
| p90 | 7.6 µs | 5.6 µs | 1.5 µs | 2.2 µs | 7.9 µs | 8.2 µs |
| p99 | 7.6 µs | 119.6 µs | 1.7 µs | 19.2 µs | 9.5 µs | 9.5 µs |
| range | stable + spikes | stable + spikes | stable | stable | stable | stable |
| Commit / item | ||||||
| avg | 9.9 µs | 12.7 µs | 0.3 µs | 18.6 µs | 0.4 µs | 0.3 µs |
| p90 | 12.3 µs | 17.2 µs | 0.4 µs | 38.6 µs | 0.5 µs | 0.4 µs |
| p99 | 105.9 µs | 49.3 µs | 0.7 µs | 65.5 µs | 0.6 µs | 0.5 µs |
| range | high start, variable | high start, variable | moderate | huge variance | moderate | moderate |
Under production conditions with a real gRPC stream, RocksDB with bloom filters delivers 3.4µs negative reads and 5.4µs positive reads — both stable regardless of memory pressure. LMDB achieves faster positive reads (3.8µs) with ample RAM, but degrades sharply under memory constraints, with commit time becoming a bottleneck at 18.6µs per item. redb offers the best positive read latency (2.1µs) but its negative read performance (94.6µs) and write latency (6.3µs) make it less suitable for a mixed workload that must handle both existing and new keys.
These results confirm the conclusion from the bootstrap benchmarks: RocksDB with bloom filters is the right choice for a system that needs predictable latency across all operation types, regardless of available memory.
Takeaways
- Memory defines the winner. With unlimited RAM, LMDB delivers the fastest reads. With moderate memory, redb’s managed I/O keeps latency predictable. Under tight memory constraints, RocksDB with bloom filters is the only engine that doesn’t degrade.
- Profile negative and positive reads separately. They tell very different stories — an engine that excels at finding existing keys may collapse when asked about keys that don’t exist, and vice versa.
- RSS lies. redb’s 1GB RSS hid 60+ GB of page cache usage. LMDB’s 63GB RSS looked alarming but was just honest reporting. Use
vmtouchto see the full picture. - Bloom filters are cheap insurance. They cost a fraction of total memory but eliminate disk I/O for non-existent keys entirely — a property no B+tree can match.
- Validate with real traffic. Synthetic benchmarks pointed to RocksDB, and the live stream confirmed it — but it could have gone differently. Real access patterns mix reads, writes, and commits in ways bulk loading can’t simulate.
- Memory pressure reveals character. Every engine looks good with unlimited RAM. Cap it to 16GB or even lower and the differences become dramatic — test under the conditions your system will actually run in.